 PPTF
PPTFChallenge pass rate
A challenge pass rate cannot be looked up — it can be worked out for your own statistics. The model runs a stage four thousand times and shows what gets in the way most often: the daily limit, the maximum, or not enough trades.
Calculation
The median number of trades to the target is —. Four thousand runs for every set of inputs, with a random number generator on a fixed seed: at the same parameters the result is always the same, otherwise two variants cannot be compared. This is a model, not a forecast; the assumptions are named below.
How many people actually pass a challenge
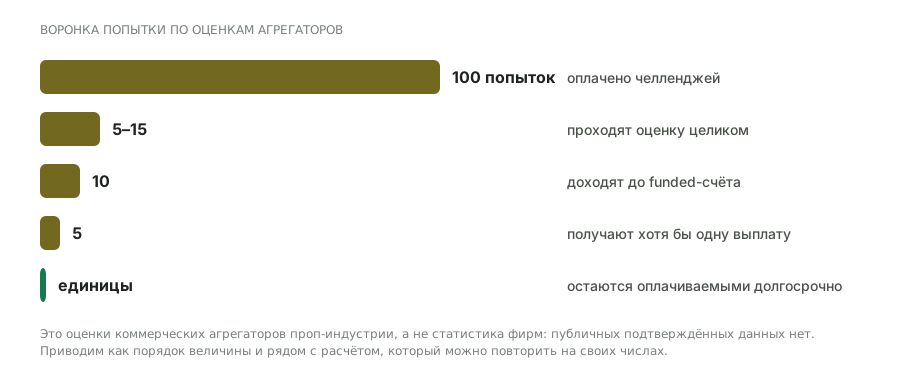
There are no public statistics confirmed by the firms themselves. Prop-industry aggregators publish estimates: a challenge pass rate of 5–10%, higher at one-step futures programmes; about half of those who reach a funded account receive at least one payout. These are commercial sites rather than a primary source, so the numbers should be held as an order of magnitude rather than as fact.
Your own calculation is more useful than someone else's average for one reason: the average includes people who traded at a size where the daily limit was breached at the third stop. Your probability depends on your numbers, and it is visible at once — move the risk slider and watch the distribution of outcomes change.
What the distribution of outcomes shows
- Failure on the daily limit predominates
- The size is too large: a run of ordinary stops closes the day. It is cured by reducing risk per trade rather than by entry precision.
- Failure on the maximum limit predominates
- The size is moderate but the edge is insufficient: the account slides down slowly. Reducing risk here only stretches the slide out.
- A lot of “not enough trades”
- The risk is too small for this target. The probability of failure is low, but you do not reach the target either — the stage runs into the cap on trades or into the deadline.
Why the model gives more than the aggregators' estimates
On the default inputs the model shows about 43% passing, while aggregators give 5–10%. That is not a contradiction: the numbers answer different questions. The model works out what happens if your win rate and average R really are those and stay those over the whole distance. The aggregate counts everyone who bought a challenge — including people with no edge at all and people who took twice the size they could afford.
You can test that right here: set the risk to 2.5% instead of 1.5% — the pass rate falls almost by half at the very same win rate and R. The edge has not changed, only the size has. That is mostly what the gap between the model figure and the market average consists of.
The non-obvious part: the number of trades a day decides which limit stops you
- Few trades a day
- At three trades the daily limit barely triggers: losses do not have time to build up within one day, and failure comes on the maximum limit — as a slow slide.
- Many trades a day
- At five and more the picture flips: the daily limit becomes the main cause of failure, because a run of three or four stops fits into one day.
- What to do about it
- It is a slider, not a constant: put in your real number of trades. The same strategy with the same statistics passes a challenge differently depending on how the trades are spread across days.
The model's assumptions
The calculation is honest exactly to the extent that its assumptions are true. They are simple, and all four push the probability up compared with reality — so the figure you get should be treated as an upper bound.
| Assumption | How it is in life |
|---|---|
| All trades are independent | Streaks cluster: the market changes regime and losses arrive in bunches |
| R is the same on every trade | Real R is scattered, and the tail of large losses is fatter than in the model |
| The win rate is constant | It changes with the market regime and with your own state |
| There is no slippage and there are no gaps | A stop fills worse than the price on news and at the open |
So the model does not answer the question “will I pass”. It answers a different, more useful one: which of the limits will stop you first — and what to change so that it stops being the main cause of failure.
How it is calculated
This problem has no analytical formula: the outcome depends on the order of the trades, not only on their composition. So the calculation is done by enumeration — four thousand simulated attempts, in each of which the trades run one after another until one of four outcomes arrives.
| Model step | What happens | In the example |
|---|---|---|
| One trade | with probability equal to the win rate, a profit of R risk, otherwise a loss of one risk | 42% at +1.5R, 58% at −1R |
| One day | the set number of trades in a row, with the daily minus accumulating inside the day | 5 trades a day |
| Outcome of an attempt | the stage target, the daily limit, the maximum limit, or the end of the trade cap | 10% · 5% · 10% · 200 trades |
| Result | the share of attempts ending in each outcome | 43.1% pass |
The expectancy of one trade is worked out separately and shown in the verdict: win rate × R − (1 − win rate). At a win rate of 42% and an average R of 1.5 that is +0.05 of risk per trade — there is an edge, but a thin one, and that is exactly why the outcome depends so heavily on the limits.
Why the result does not change on reload. The random number generator is deterministic: the same inputs give the same figure. That is deliberate — otherwise two people with the same numbers would get different results and could not compare them.
How to read the result
The absolute percentage here is less useful than the distribution of causes of failure: it shows what exactly to change. Look at which of the three failure outcomes is the most common.
It is worth checking the reverse too: set the risk to 0.5% and watch the pass rate fall not because of the limits but because the trades run out. An optimum size exists, and it is not at the edge of the range — that is the least obvious conclusion of the model.
Frequently asked questions
Why does the result not change on the same inputs?
The random number generator runs on a fixed seed. That is deliberate: with “real” randomness the figure would drift with every movement of a slider and two sets of parameters could not be compared.
Which win rate and R should I use if I have no statistics?
None. Numbers put in by eye give an answer that cannot be trusted — and it looks just as convincing as a real one. First two hundred trades of your own history, then the model.
Why does reducing risk not always raise the probability?
Because it works both ways: failure on a limit becomes rarer, but you reach the stage target more slowly and run into the trade cap more often. On the chart it shows as a flow from “daily limit” into “not enough trades”. The optimum is usually not at the edge.
Does the model allow for minimum trading days?
No, that is what the day plan is for: there the minimum days and the consistency rule set the length of a stage. Here what is worked out is the probability of reaching the target without breaching the drawdown limits.
What is average R and how do I work it out?
It is the ratio of the average winning trade to the average loss, expressed in units of risk. Add all the wins, divide by their number, do the same for the losses, and divide the first by the second. R = 1.5 means the average win is one and a half times the average loss.
Why four thousand runs and not more?
Because beyond that the figure stops changing within a tenth of a per cent, while the calculation has to be instant as a slider moves. More runs would give the same figure and a noticeable delay.
How many trades does the history need for the model to be trusted?
Of the order of two hundred at least. On a smaller sample the win rate and average R are estimated too roughly: a shift of five percentage points changes the pass rate several times over.
Why does the model not allow for consecutive streaks?
Because it treats trades as independent, while in life they cluster: the market changes regime and losses arrive in bunches. That is one of four assumptions, and all of them push the probability up. The figure you get is an upper bound, not an estimate.
Can this model be used to compare two firms?
Yes, and that is its main use. Put in your own statistics and the first firm's limits, note the distribution of outcomes, then the second firm's limits. The seed is fixed, so the difference in the numbers will come from the terms rather than from chance.
Which matters more for passing, win rate or R?
Their product. A win rate of 40% at R = 2 gives a positive expectancy, while a win rate of 55% at R = 0.8 gives a negative one. That is why comparing strategies by win rate alone is pointless.
Read next
