 PPTF
PPTFA simulator of consecutive losing trades
A run of losing trades is not an anomaly but a property of any strategy with a win rate below one hundred per cent. The simulator shows at which stop a streak runs into a limit and what is left of the account by then.
Calculation
Risk is counted from current equity, so a streak compounds: each stop is smaller than the last in money terms. If your firm counts risk from the starting balance, the streak is linear and the limit is breached one or two stops sooner.
Streaks are longer than people assume
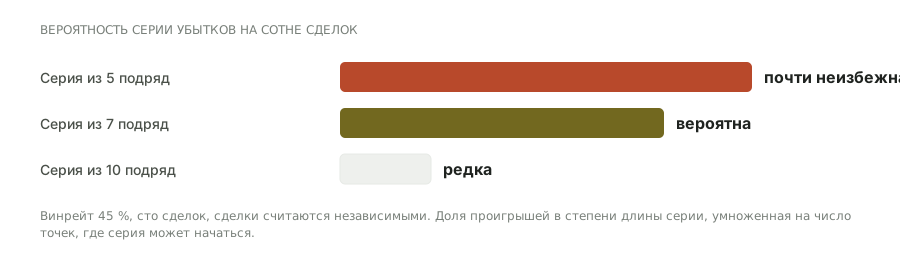
Intuition says that at a win rate of 50% six losses in a row are rare. The arithmetic says otherwise: the probability of such a streak at one particular point is about 1.6%, but over a distance of two hundred trades it occurs almost certainly. And a challenge is precisely a distance of one or two hundred trades.
| Win rate | A streak of 5 | A streak of 7 | A streak of 10 |
|---|---|---|---|
| 55 % | 1.8 % | 0.4 % | 0.03 % |
| 50 % | 3.1 % | 0.8 % | 0.10 % |
| 45 % | 5.0 % | 1.5 % | 0.25 % |
| 40 % | 7.8 % | 2.8 % | 0.60 % |
The table gives the probability of meeting a streak of a given length starting from a particular trade: simply the share of losses raised to the power of the streak length. To get the probability of at least one such streak over a stage, multiply it by the number of trades — and then the “rare” event becomes expected.
Why this is settled by size rather than by discipline
A streak cannot be prevented: it follows from the distribution rather than from mistakes. The only lever is position size, because it decides how much money each stop turns into. Hence the reverse order of calculation: first you choose the streak the account has to survive, then risk per trade follows from it, and only then the size.
What to do when a streak is already under way
Inside a streak there are almost no decisions left: the size was chosen in advance, and changing it midway means breaking the calculation it came from. Three ways of behaving differ not in courage but in what they do to the remaining cushion.
Two situations that look alike are worth telling apart. A streak inside a single day spends the daily limit and resets by the next session. A streak stretched over a week spends the maximum limit — and that never resets, so the cushion spent will not come back. The first situation is unpleasant, the second dangerous, and the simulator shows both: the “stops to the daily limit” line and the “to the maximum” line answer different questions.
How it is calculated
The calculation compounds rather than multiplying the risk by the length of the streak. The difference is fundamental: a risk of 1.25% on the second trade is taken from equity that has already shrunk, so a streak costs less than a linear count suggests — but not by much, and on long streaks that does not save you.
| Value | Formula | In the example |
|---|---|---|
| Equity after k stops | account × (1 − risk)^k | $92,731 at the 6th |
| Drawdown after the streak | 1 − (1 − risk)^k | 7.3 % |
| The stop at which the daily limit is breached | the smallest k at which the drawdown exceeds the daily limit | the 5th |
| The stop at which the maximum is breached | the smallest k at which the drawdown exceeds the maximum | the 9th |
In the example the account is $100,000, risk 1.25% per trade, the daily limit 5%, the maximum 10%, the streak six stops. A linear count would give 6 × 1.25 = 7.5% of drawdown, compounding gives 7.3%: a difference of 0.2 of a percentage point. It cannot be relied on as a cushion.
Why the daily limit is breached before the maximum. Because it is smaller and resets every day: a streak of five stops in one day closes the account at a 5% daily limit even if the total drawdown is only 6%. The same streak stretched over a week does not touch the daily limit at all — at the same final minus.
How to read the result
The key figure is not the drawdown after the streak but the number of the stop at which the daily limit is breached. Compare it with your worst streak from your trade history, not with your average.
What the calculation does not account for
Three simplifications, and all three shift the result to the optimistic side: a real streak costs more than the calculated one.
- The stops are counted as identical
- In the calculation every loss equals the risk you set. In life there is slippage, a gap and a stop that filled worse than stated — and such a trade costs more than one stop.
- Costs are not deducted
- Spread, commission and swap are added to every loss. At a scalper's turnover that is a noticeable amount, and it brings the limit closer.
- Winning trades inside the streak are not considered
- The calculation takes a clean run in a row. A mixed sequence with wins in the middle gives a different trajectory — that is what the probability of passing works out.
All three simplifications mean one thing: the number of the stop at which the calculation breaches the limit is an upper bound. On a real account the limit will arrive at the same stop or sooner, but not later.
Frequently asked questions
How many losing trades in a row count as normal?
Normal is defined not by a number but by your win rate and the length of the stage. At a win rate of 45% over a distance of two hundred trades a streak of six losses is to be expected and one of eight is quite possible. Plan around the longest streak in your own history plus a margin.
Why is the streak compounded?
Because risk in per cent is usually taken from current equity: after a loss the account is smaller, so the next stop is smaller in money. That is slightly softer than a linear model. If your firm counts risk from the starting balance, the streak is linear and the limit is breached one or two stops sooner.
What if the streak does not fit inside the daily limit?
Reduce the size — there are no other levers. Neither cutting the number of trades nor moving to another instrument changes the arithmetic if the risk per trade stays the same.
How do I find my worst streak?
Sort the trade history by time and find the longest run of consecutive losses in the last two hundred trades. That number is the requirement for the cushion — plus one or two stops for the fact that the record has not been set yet.
Is a losing streak a sign that the strategy has stopped working?
Not in itself. At a win rate of 45% a streak of six losses is to be expected over the length of a stage and says nothing about the quality of a strategy. What should give you pause is a streak substantially longer than the historical one, not any streak at all.
Why does the model compound rather than count linearly?
Because risk is usually set as a percentage of current equity: after a loss the account is smaller, so the next stop is smaller in money. That is slightly softer than a linear model, and if your firm counts risk from the starting balance the limit is breached one or two stops sooner.
What if the losses are not consecutive but mixed with wins?
Then the limit is further away, and that is the normal case. The simulator computes the worst realistic scenario: it exists so that the size withstands a bad patch, not to predict a typical week.
Does the number of trades per day affect the outcome?
Strongly. The daily limit is counted per day, so at five trades a day a run of three stops fits into one day, while at one trade a day it stretches over three. The same statistics at different frequencies give different outcomes.
Does the calculation allow for open positions?
No, it is about closed stops. If the daily limit is measured from equity, an open loss already reduces the cushion and the actual streak will be shorter than the calculated one.
Does increasing size after a losing streak help win it back?
No, it speeds up failure. Raising the risk after losses cuts the number of stops to the limit at exactly the moment when the streak may still continue. The simulator shows it at once: raise the risk and watch the number of stops to the daily limit fall.
Read next
