 PPTF
PPTFLot calculator for drawdown limits
The lot calculator sizes a position from the firm's limits, not from the profit you want. It is the first calculation before buying a challenge: it sets all the others and often answers straight away whether the firm suits you.
Calculation
The pip value is a slider, not a constant: $10 is right for a standard lot of a major currency pair, and for indices, metals and crypto the value is different. Size is rounded down to 0.01 lots: rounding up means deliberately stepping outside the limit.
How it is calculated
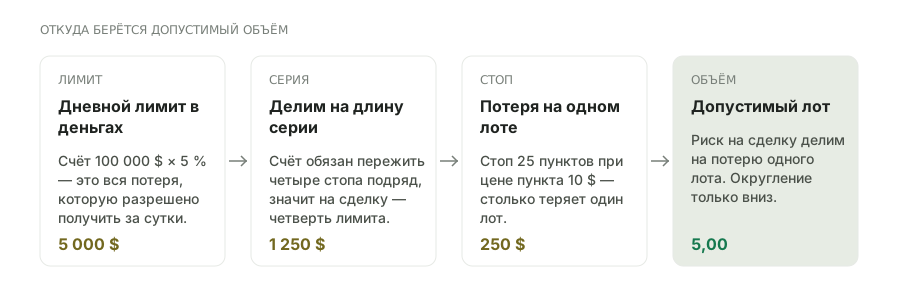
The formula is short, and the whole point is what the risk per trade is taken from. It follows not from a “1% rule” but from the daily limit divided by the streak of stops the account has to survive.
| Value | Formula | In the example |
|---|---|---|
| Daily limit in money | account × daily limit % | $5,000 |
| Risk per trade | daily limit ÷ length of streak | $1,250 |
| Loss on 1 lot | stop in pips × pip value | $250 |
| Allowed size | risk per trade ÷ loss on 1 lot | 5.00 lots |
In the example the account is $100,000, the daily limit 5%, the stop 25 pips, the pip value $10, the streak four stops. The size comes out at 5.00 lots — and this is exactly the case where you should stop and read it again: five lots on a $100,000 account looks like a lot, and the arithmetic is right. The reason is the short stop: 25 pips on 5 lots is the same $1,250.
What breaks this calculation most often. The pip value. It is exactly $10 per standard lot only on pairs quoted in dollars — EUR/USD, GBP/USD, AUD/USD. On USD/JPY, USD/CHF and USD/CAD the dollar is the base currency and the pip value depends on the current rate; and for gold, indices and crypto the figure is different, changing the size several times over. Take $10 out of habit and the lot comes out inflated and the limit breached.
A forex risk-per-trade calculator: why risk is divided by the streak
The familiar “risk no more than 1% per trade” arose for your own account, where drawdown is limited only by your patience. In a challenge the boundary is hard and double, and the right question is a different one: how many stops in a row must the account withstand so that a streak does not close it.
The difference shows in the numbers. With a 5% daily limit a risk of 1% gives five stops before the day is closed — a cushion at first glance. But if the strategy produces streaks of six or seven losses (and that is normal at a win rate of 45%), the limit is breached on the very first bad day. That is why the length of the streak is a slider, and its value comes from your statistics rather than from advice.
Where to get the length of the streak
- From your own trade history
- Find the longest losing streak in the last two hundred trades and add one or two to it. That is the requirement for the cushion.
- If there is no history
- There is nothing to compute, and that is the answer: statistics first, challenge second. A number put in by eye gives a calculation that cannot be trusted.
- Why the streak is longer than it seems
- At a win rate of 45% a streak of six losses in a row occurs about once in a hundred trades — that is, almost certainly inside a single stage.
How to read the result
Three of the four numbers are consequences, and they should be read together. Size on its own says nothing: it is judged through the risk in per cent and through how many stops there are to each limit.
What the calculator does not account for
Four things stay outside the calculation, and each of them works against you rather than for you.
A stop fills worse than the price on news and at the open. The actual loss turns out larger than the calculated one, and the limit does not move to accommodate it.
leave roomA position trade pays swap every night. On long holds it becomes comparable to a stop and also reduces the cushion up to the limit.
for position tradersThe calculation is about one trade. Two correlated positions of the same size work as one double — the risk adds up rather than averaging out.
count them togetherIf the daily limit is measured from equity, an open losing position already reduces the cushion even though the stop has not triggered.
check the baseFrequently asked questions
Why does the calculator round the size down?
Because rounding up steps outside the limit. Rounding 0.428 up to 0.43 lots raises the risk per trade, and the streak you were counting on stops fitting. Every derived number is computed from the rounded size rather than the ideal one, so the lines agree with the total.
What if the size comes out as 0.00?
It means that with this stop and this pip value even the minimum 0.01 lots does not fit inside the risk allotted to a trade. The calculator shows what stop is needed to fit. There are three options: a shorter stop, a shorter streak or another instrument with a smaller pip value.
Does it account for the maximum limit?
Yes, but not as a cap on size — as a consequence: the calculator shows how many stops in a row the account survives up to the maximum limit. The daily limit is stricter per trade, so the size is worked out from it.
Can the same arithmetic be used for instant funding?
Yes, it is the same: drawdown limits exist there too, and there is no profit target. Put in the limits of your own programme.
How does calculating risk per trade in forex differ from other markets?
In the pip value and its stability. On major currency pairs it is predictable and close to $10 per standard lot, so the size is worked out once and holds. On indices and crypto the figure is different and floats, and it has to be recomputed for every instrument.
Where do I get the pip value for my instrument?
From the contract specification at the broker or platform: it states the contract size and the tick. For a standard lot of a major currency pair it is about $10 per pip; for gold, indices and crypto the figures are different, sometimes several times over. Putting in $10 out of habit inflates the size.
Why is risk divided by the streak rather than taken as 1%?
The “1% per trade” rule arose for your own account, where drawdown is limited by patience. In a challenge the boundary is hard: what matters is not the percentage but how many stops in a row the account survives. Risk follows from the requirement for a cushion, not the other way round.
What if the strategy uses several positions at once?
Then risk is counted across all open positions together, not one by one. Two correlated trades of the same size work as one double, and the size you calculated has to be divided between them rather than used for each.
Should room be left for slippage?
Yes, and it is a separate amount. The calculation assumes the stop fills at the price, and on news and at the open it fills worse. A practical device is to count the streak one stop longer than your historical worst.
What if the allowed size is smaller than the firm's minimum lot?
That is an answer about compatibility: with this stop and these limits the firm does not suit your strategy. The options are a bigger account, a shorter stop, an instrument with a smaller pip value or another firm with a softer daily limit. Opening the minimum lot “because nothing smaller is allowed” means starting from a calculation that is already breached.
Read next
